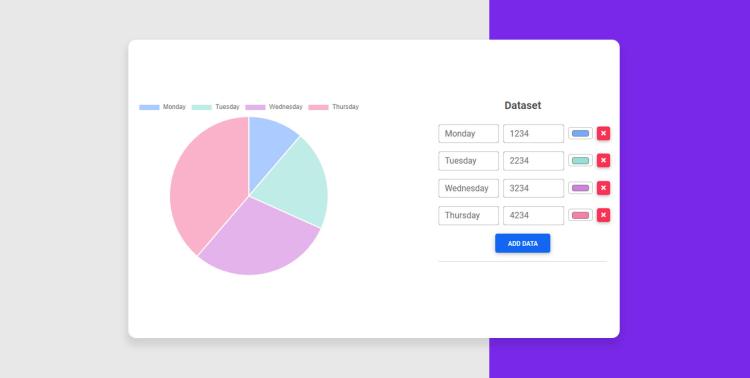
Bootstrap Chart Builder | Pie charts | Line graphs – Anak
            const dataBar = {
                type: "bar",
                data: {
                labels: ["Monday", "Tuesday", "Wednesday", "Thursday"],
                datasets: [
                    {
                    label: "Traffic",
                    data: [3234, 2234, 3234, 1234],
                    backgroundColor: [
                        "rgba(66, 133, 244, 0.6)",
                        "rgba(66, 133, 244, 0.6)",
                        "rgba(66, 133, 244, 0.6)",
                        "rgba(66, 133, 244, 0.6)",
                    ],
                    },
                ],
                },
            };

            new mdb.Chart(document.getElementById("chart-bar"), dataBar);
<canvas id="chart-bar"></canvas>
Related Post
